@_ScottCondron
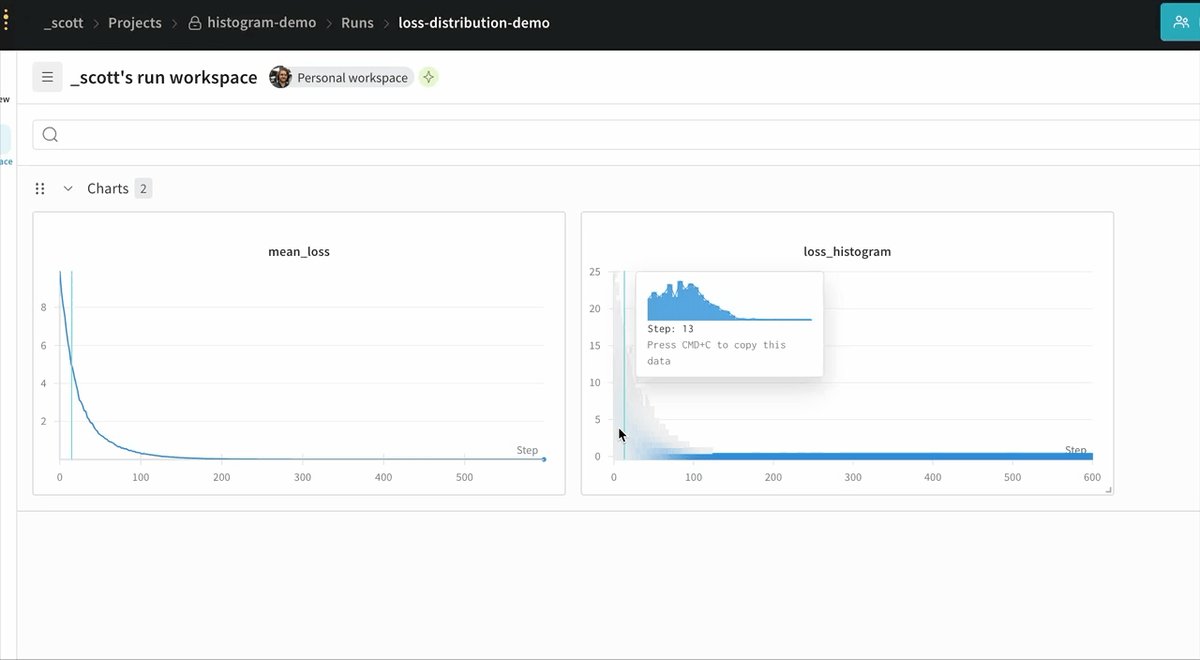
niche tip: If you're looking to view histograms / distributions of data per step in wandb, you can log using `wandb.Histogram(loss_array)` and you get a plot where you can hover over each step and see the distribution change during training https://t.co/gX8asUaOvL