@simongerman600
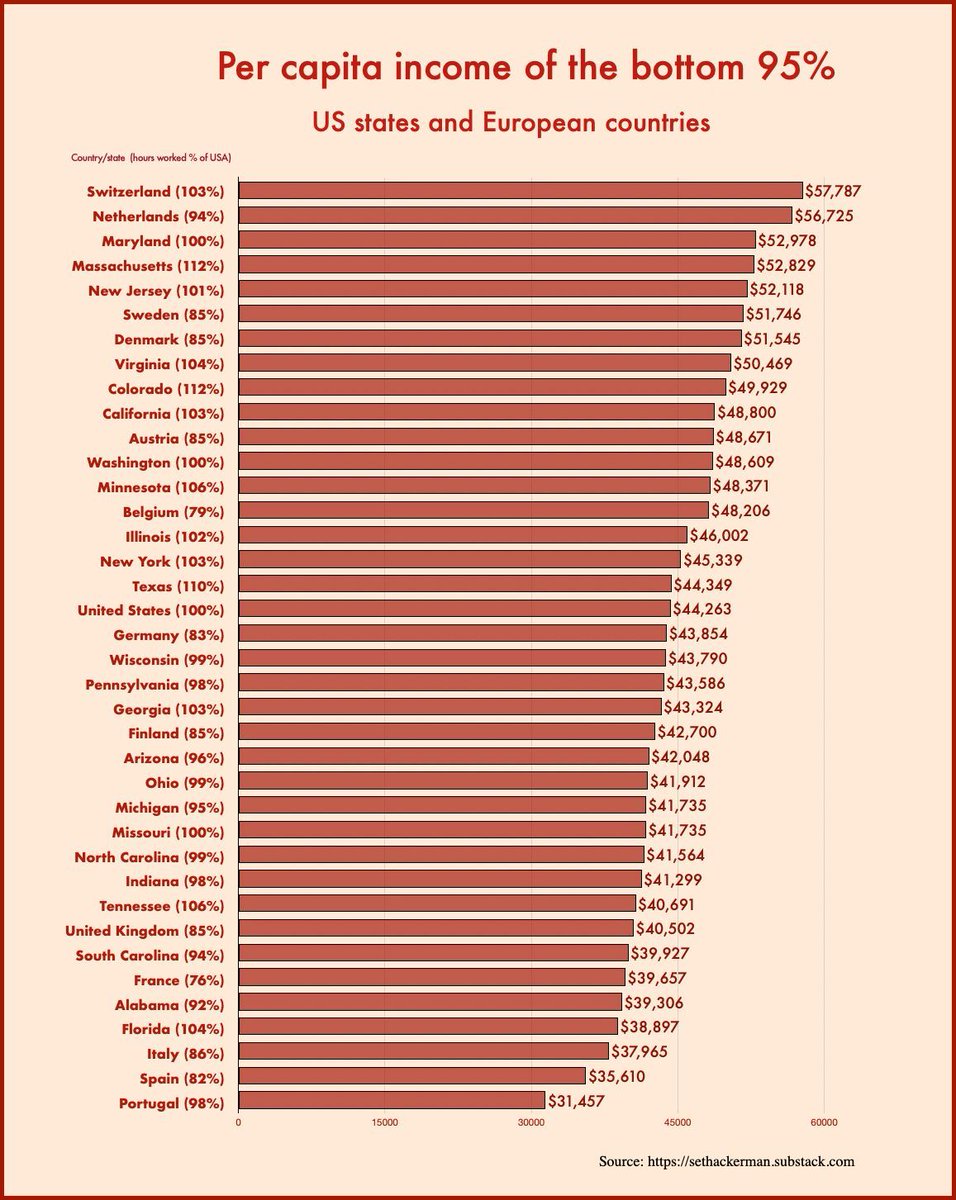
How to read this chart: the typical Belgian earns as much as the typical Californian but works about 24% less. Pretty smart move to calculate such data for the “bottom 95%” only. Worth exploring further. Source: https://t.co/Mfv6fc8DGw https://t.co/D6zuzB35Ju