@fchollet
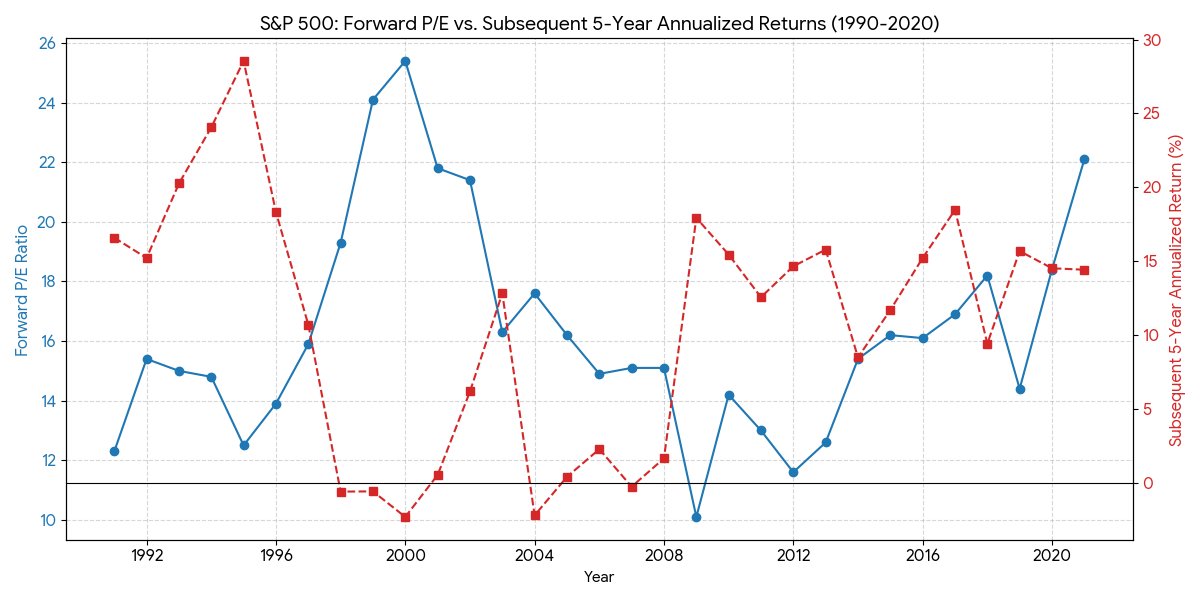
Every chart crime has a corresponding "correct" data visualization that pretends the same information in an unbiased way. Below: a quarterly timeseries of SPX forward PEs and annualized 5-year forward returns (note: this is 5 year instead of 10 because that's what I wanted to look at) Right now the SPX forward PE is 19.8x. Here are the closest tuples to this value, historically: Q4 1997: 19.3x ➡️ -0.6% Q4 2000: 21.8x ➡️+0.5% Q4 2001: 21.4x ➡️+6.2% Q4 2017: 18.2x ➡️+9.4% Q4 2019: 18.4x ➡️+14.5% Q4 2020: 22.1x ➡️+14.4% The inverse correlation between forward PE and future returns is real, but it is weak and you absolutely cannot infer that future returns from now on will be low or negative