@fchollet
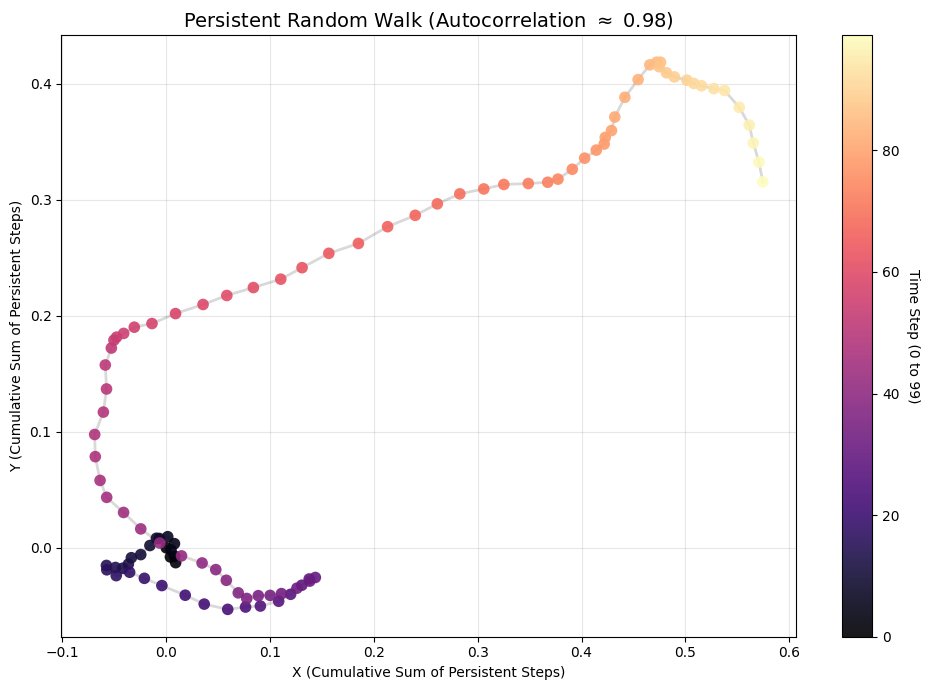
Ok, this thread has apparently been a magnet for hordes drooling morons who not only don't get stats, but can't even read. If you're a normally intelligent reader of this tweet, here's an extra example of my point: If you take two RANDOM, INDEPENDENT timeseries (i.e. knowing one gives you NO information about the other) that are each highly temporally autocorrelated (e.g. two random walks), and you plot one against the other as a scatter plot, what you get is a single X/Y trajectory that will ALWAYS look very structured. Yet it is random. Like the figure below. Code to reproduce the figure and play around with this idea: https://t.co/OZPfxCRN3s Of course if the two series happen to be correlated, then you will ALSO see something very structured. It's just that this type of visualization is a completely retarded way to look at such data. If you think this is deep, you are innumerate.