@llama_index
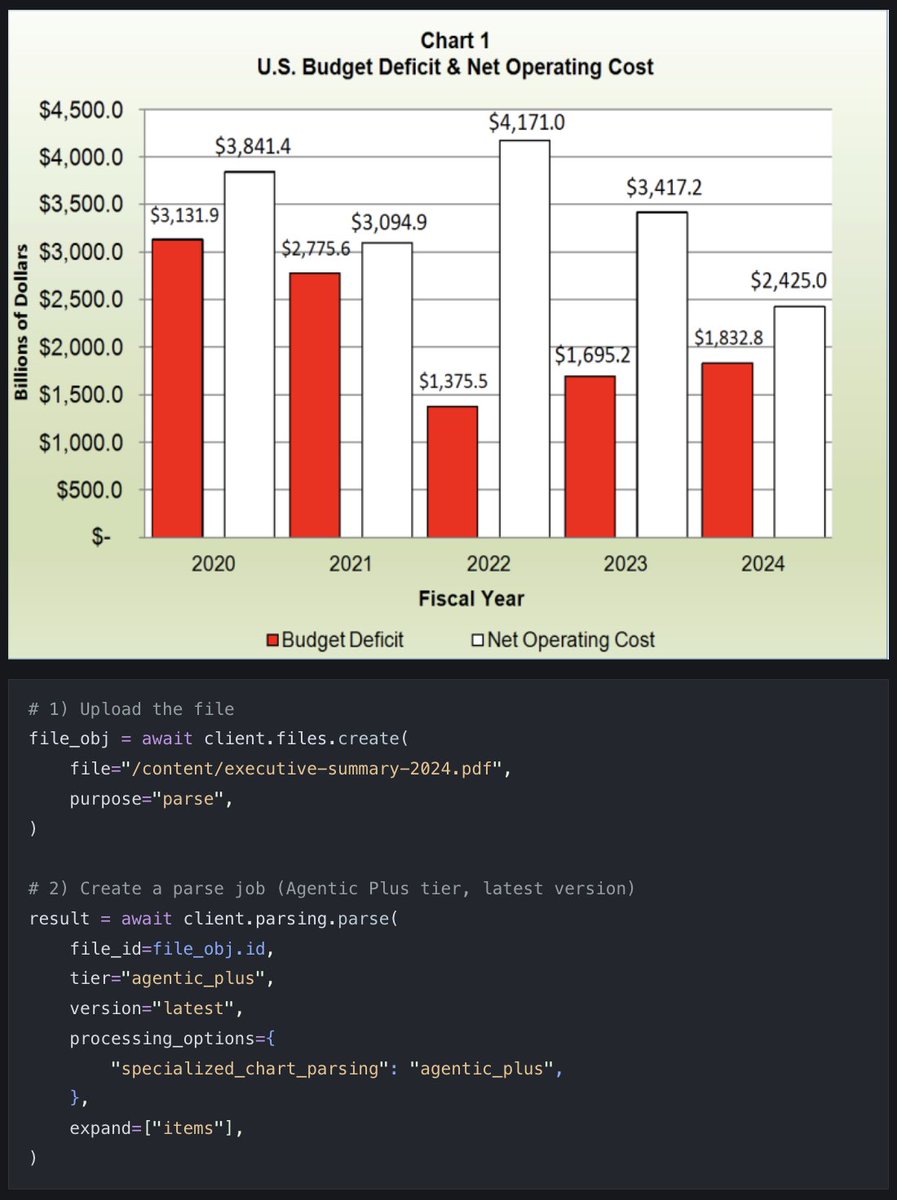
Turn your PDF charts into pandas DataFrames with specialized chart parsing in LlamaParse! This tutorial walks you through extracting structured data from charts and graphs in PDFs, then running data analysis with pandas - no manual data entry required. 📊 Enable specialized chart parsing to convert visual charts into structured table data 🐼 Extract table rows directly from parsed PDF pages and load them into DataFrames 📈 Perform year-over-year analysis, calculate gaps between metrics, and create visualizations ⚡ Use the items view to get per-page structured data including tables and figures We demonstrate this using a 2024 Executive Summary PDF, extracting a fiscal year chart showing Budget Deficit vs Net Operating Cost data spanning 2020-2024, and reproducing the key financial insights. Check out the full tutorial: https://t.co/sOVtFM3xE1